Our Data
Overview and Data Sources
Our research utilizes a comprehensive dataset comprising several main files for each region for a certain year. We are investigating Washington State in our research.
- Flow file (.csv): The flow data is fetched from GeoDS Lab and sourced from SafeGraph, which includes detailed records of crowd flow. It features the following columns:
- geoid_o: Geoid of the origin.
- geoid_d: Geoid of the destination.
- lat_o: Latitude of the origin.
- lng_o: Longitude of the origin.
- lat_d: Latitude of the destination.
- lng_d: Longitude of the destination.
- pop_flows: Estimated population flows between origin and destination based on the GPS detected by SafeGraph.
- Features file (.csv): The features file contains data used to measure the socioeconomic characteristics or other attributes of a place, which is derived from the United States Census Bureau. It features the following columns:
- geoid: Geoid of each census tract.
- total_population: Total population for each census tract.
- feature_1: To be determined, depending on the specific characteristics we aim to study. These features are not necessary for gravity and non-linear gravity models.
- feature_2: To be determined, depending on the specific characteristics we aim to study. These features are not necessary for gravity and non-linear gravity models.
- feature_n: To be determined, depending on the specific characteristics we aim to study. These features are not necessary for gravity and non-linear gravity models.
- Demographics file (.csv): The demographics file is Centers for Disease Control and Prevention, provides demographic information for evaluation use. It features the following columns:
- geoid: Geoid of each census tract.
- svi: Social Vulnerability Index(SVI) score, which measures the resilience of each census tract when confronted by external stresses on human health.
- Tesselations file (.geojson): This file contains tessellations for census tracts in the study area, census tracts data in Washington State is fetched from Washington State Office of Financial Management.
- GEOID: Geographic identifier for census tracts
- Total_population: The total population of the tessellated area
- geometry: Geospatial data defining the boundaries of each tessellation.
- Boundary file (.geojson): The file outlines the boundaries of the study area which provides geospatial context, Washington State boundary file is fetched from Washington Geospatial Open Data Portal.
Train Test Split

Regions of Interest and Stratification
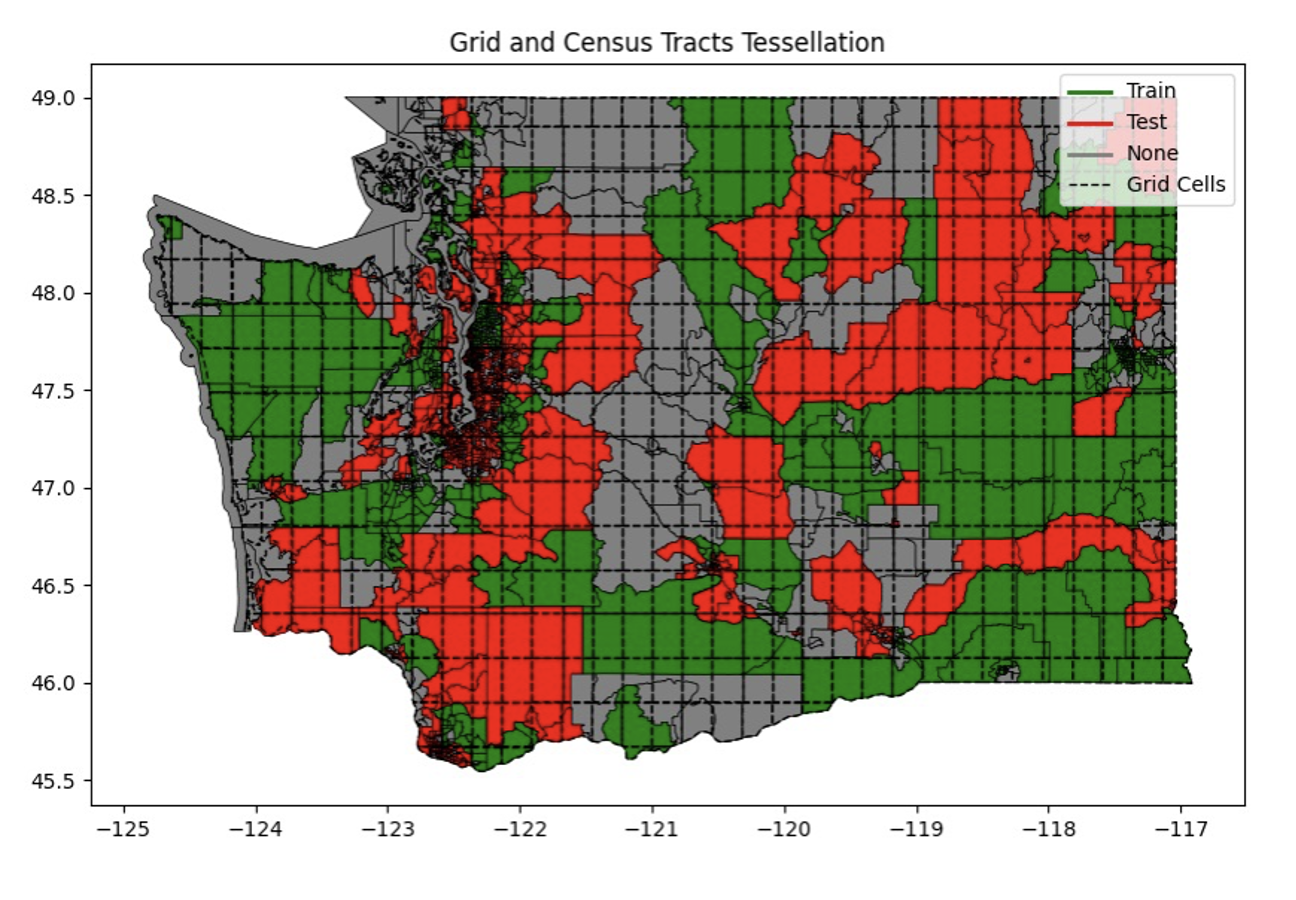
The train_test_split function is designed to partition a dataset into training and testing subsets, ensuring that the division preserves the distribution of a key demographic feature. The method begins by defining regions of interest (ROIs) within the dataset, based on the structure of the data.
For our research, the dataset consists of geographical data, which is first segmented into grid cells, each representing a region. Each cell is treated as an independent region of interest. The grid is constructed based on predefined tessellation, which covers the entire area of study. These regions are then used to represent the spatial distribution of the population or other key demographic features within the dataset.
Stratified Sampling Based on Demographic Features
The function employs a stratified sampling approach to ensure that both the training and testing sets maintain the same proportional representation of demographic features. Specifically, the regions are stratified based on population deciles, ensuring that each subset (training and testing) contains a representative distribution of populations.
The stratification process involves sorting the regions of interest based on their population size, and then dividing them into deciles. This ensures that each decile is equally represented in both the training and testing sets, which is crucial for maintaining the integrity of the model’s performance across different population groups.
Implementation
The function is implemented using a customized process and leveraging scikit-learn library in Python.
-
Grid Construction: A grid is constructed over the entire study area using a tessellation approach. Each cell in the grid is treated as an independent region of interest.
-
Population Decile Calculation: The population of each region of interest is calculated, and the regions are divided into deciles based on their population sizes.
-
Stratified Split: The regions are then randomly allocated into training and testing sets, ensuring that each decile is proportionally represented in both sets. This stratified split ensures that the model is trained and tested on data that reflects the same demographic distribution.
-
Output Generation: The function outputs six datasets: a training set and a testing set for flows, tessellations and features.
Bias Sampling
To investigate bias in crowd flow, we use a sampling methodology that adjusts the flow data based on the selected demographic feature of destinations. The approach involves several steps. The methodology consists of two independent methods with similar procedures, differing only in the way demographic features are considered.
some visualization
Method 1: Sampling based on destination demographic feature
Procedure:
-
Calculate Percentile: Determine the percentile rank of each destination’s demographic feature. This helps to position each destination within the overall demographic distribution.
-
Adjust Flows: Modify the original flow data by applying a fixed bias factor to the percentile rank. Normalize these adjustments to ensure that the total adjusted flow maintains the original proportions but reflects the demographic weighting.
-
Sampling: Sample the total adjusted outflows with replacement, using the normalized probabilities to incorporate the demographic-based bias.
Method 2: Sampling based on the difference of demographics between origin and destination
Procedure:
-
Calculate Difference: Determine the absolute difference in the demographic feature between the origin and destination.
-
Calculate Percentile: Determine the percentile rank of each origin-destination pair’s demographic feature difference.
-
Adjust Flows: Modify the original flow data based on the calculated difference and apply a fixed bias factor. Normalize these adjustments to reflect the demographic disparity.
-
Sampling: Sample the total adjusted outflows with replacement, using the normalized probabilities to incorporate the demographic-based bias.